
Client profile
A biopharma patient and brand analytics team with long established dashboards, where data is large, and every question required manual lookup and everytime a resource would manually do an analysis to provide an answer. The client wanted to make routine commercial intelligence easier to access without creating another analytics platform or another source of truth.
Context and objectives
A commercial leader can ask a simple question such as, “How is this territory trending against plan?” In many organizations, that question still enters an analyst queue even when the underlying metric already exists. Someone must locate the SQL table then query then push it to into the right dashboard or visualize it then confirm the business definition, apply the filters, interpret the movement, and return the answer in a form the business user can act on.
The bottleneck was therefore not data availability. It was the distance between a business question and a governed answer.
The objective was to make recurring descriptive and diagnostic questions more self-service while preserving control over metric definitions. Business users should be able to ask supported questions in plain language, receive the relevant visualization and explanation, and share the finding without needing SQL or detailed dashboard knowledge. More complex work—forecasting, causal analysis, advanced modeling, or questions without an approved metric definition—would continue to route to analytics specialists.
The solution
- Improzo started with the questions commercial users asked most often and mapped them to governed business measures.
- Improzo used an AI layer on top of the dashboards for selected KPIs, goals, and comparison periods so the experience stayed anchored to centrally defined metrics rather than creating a parallel calculation layer.
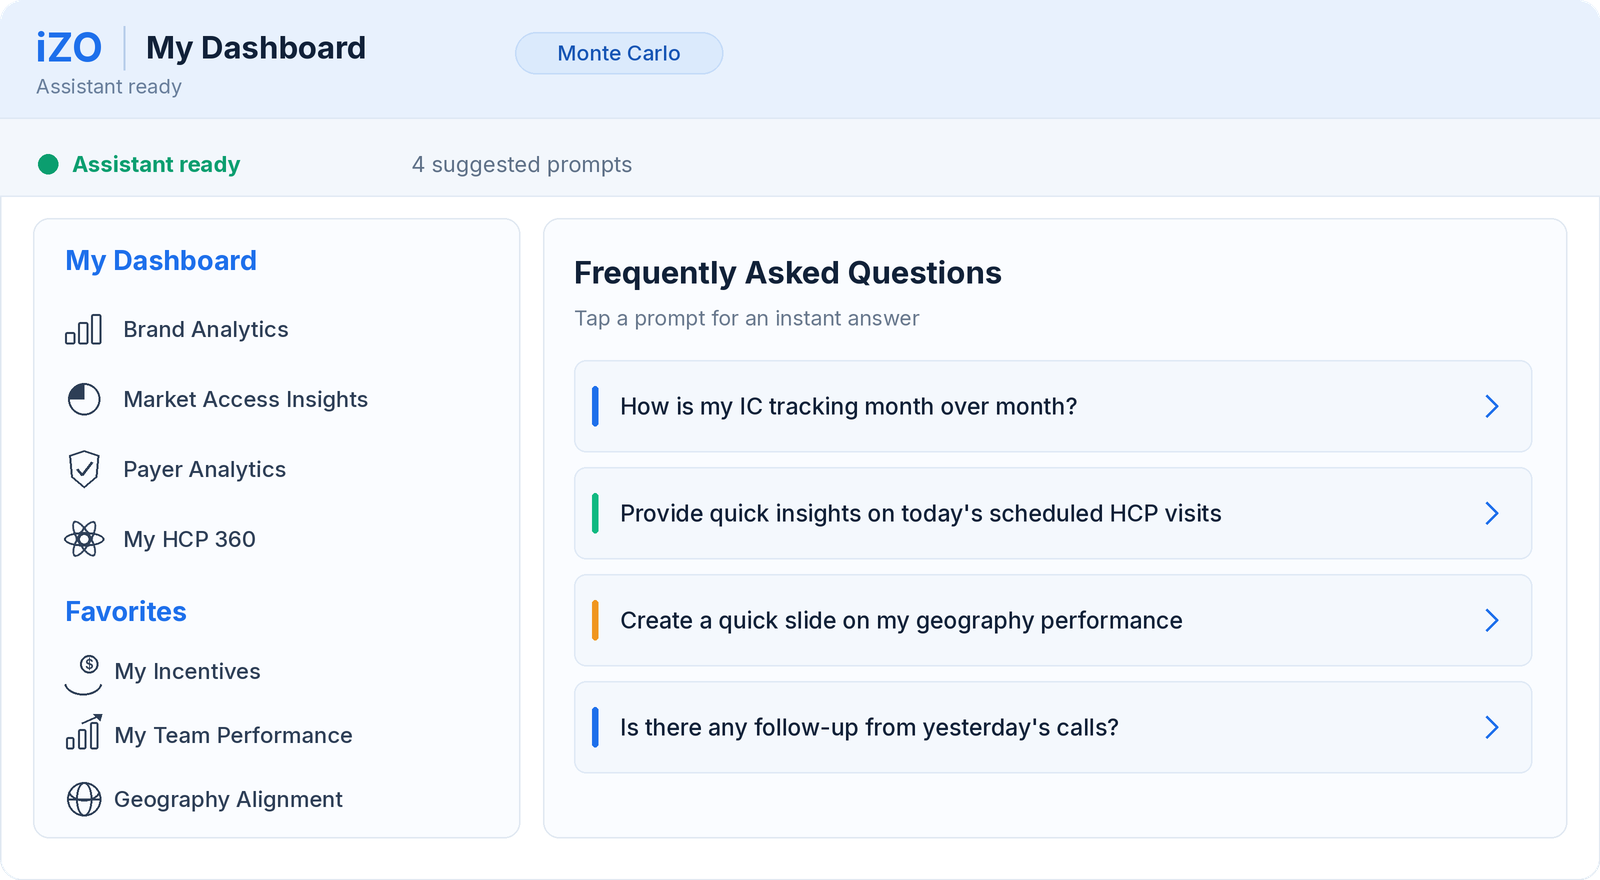
- iZO added a business-language interface over that governed metric layer. A user could ask a question using familiar commercial terms instead of knowing a table name, query syntax, or dashboard structure.
- The system used the user’s question and role context to identify the appropriate metric, retrieve the governed result, and return it as a visualization with a concise plain-language explanation.
- Where appropriate, the experience suggested a useful follow-up question or next analytical step. Unsupported or higher-order analytical questions were not forced into a conversational answer; they could be routed back to specialist teams.
The impact
Routine commercial intelligence became easier to access without replacing the existing analytics stack. Business users could move from a supported question to a governed answer with less technical handoff, while analytics teams could spend more time on work that genuinely required specialist expertise.
The approach also improved consistency. Because answers were anchored to controlled metric definitions, users were less likely to recreate slightly different versions of the same KPI in separate analyses.
The reusable asset is broader than the interface itself: the business vocabulary, metric mappings, question patterns, role context, and routing rules can be extended across brands, geographies, and functions. The value came from shortening the distance between the question and the decision while making the client’s existing Tableau investment more usable.